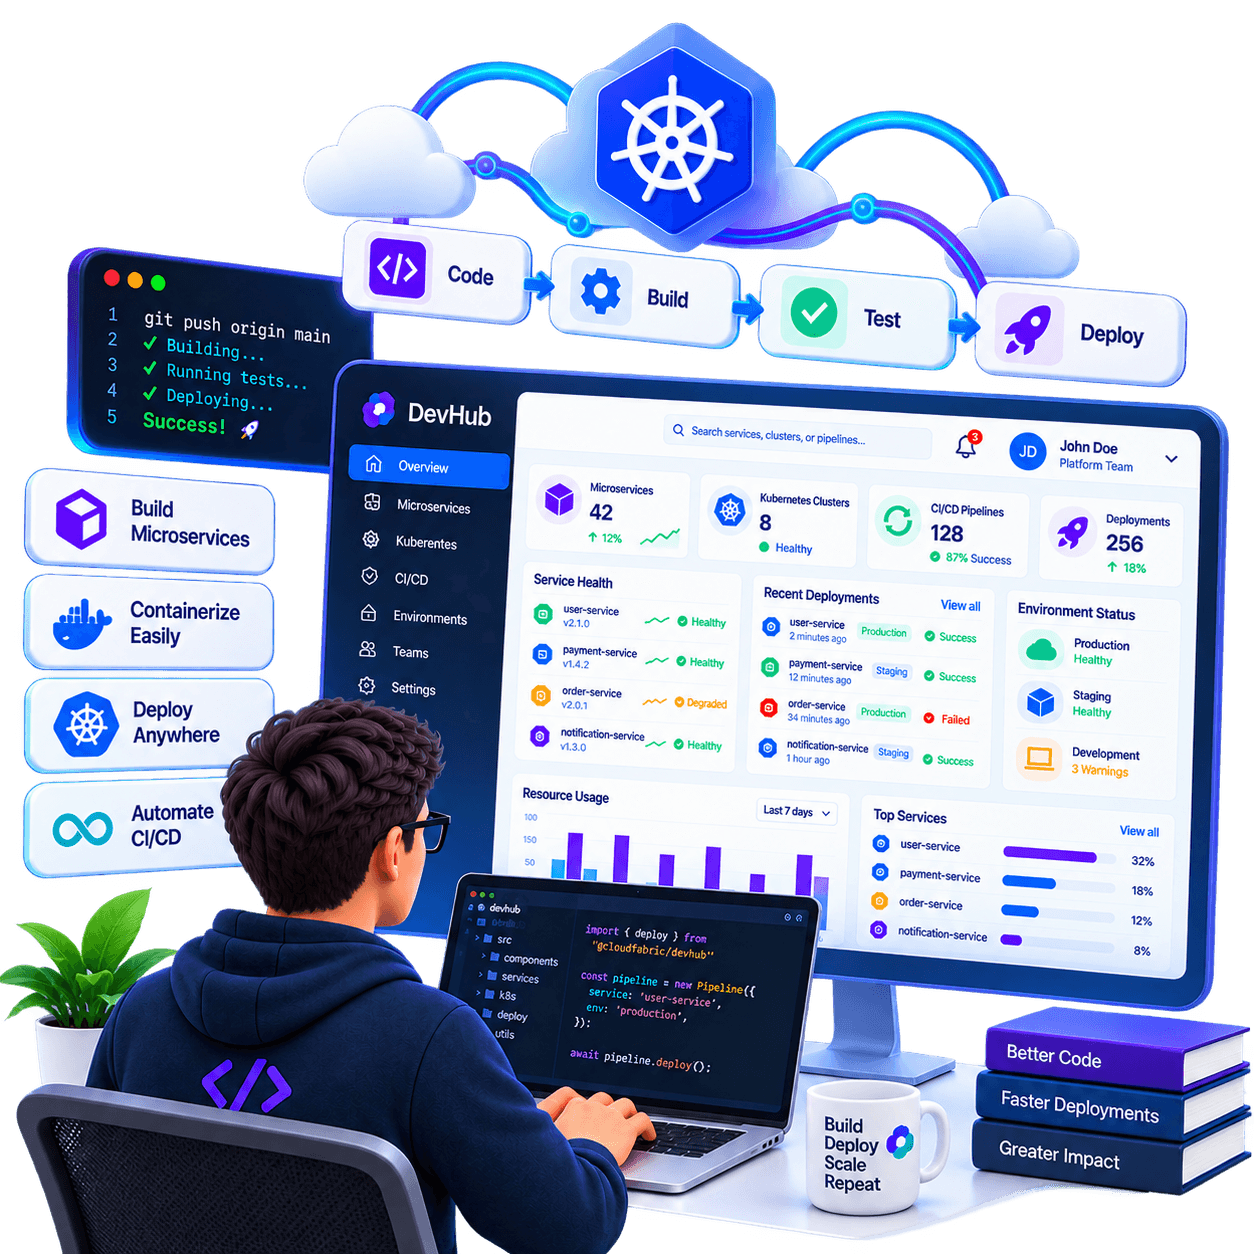
One dashboard for every cluster,
pipeline, and security scan.

DevHub gives platform and DevOps teams a single place to see cluster health, microservice status, CI/CD pipeline performance, and security posture. Works with any Kubernetes cluster — no agents required.

DevHub IDP Platform 3D Illustration

The Problem

Troubleshooting Kubernetes shouldn't require 15 terminal windows.

When an incident strikes, DevOps engineers waste hours switching between kubectl contexts, hunting through fragmented pod logs, checking pipeline failure trends, and cross-referencing security scanners. DevHub unifies multi-cluster health, guided diagnostics, and pipeline intelligence in one central platform.

×

Multi-cluster blind spots across EKS, AKS, and on-premises environments

×

Repetitive manual kubectl debugging for CrashLoopBackOff, OOMKilled, and eviction events

×

Fragmented CI/CD monitoring with disconnected build logs and deployment failure stats

×

Security scans (SAST, DAST, container CVEs) isolated from runtime cluster context

The Promise

“One dashboard for every cluster, pipeline, and security scan your team owns.”
STAGE 01

DEVHUB · PLATFORM READINESS

Cluster Health at a Glance.

Get cluster health, active microservices, and open security issues in one unified readiness view across all connected environments.

Devhub
DevHub — Platform Readiness
Readiness
Kube Inventory
KubeShoot
CI/CD

4 connected clusters · 60 nodes · 876 pods · Agentless Kubernetes connection

Cluster Health
3/4
▲ 1 degraded
Microservices
42
↑ active in catalog
Critical Security
3
↓ open CVEs

Connected Clusters & Infrastructure

eks-prod-us-east-1EKS
24 nodes · 380 pods
100% Healthy
aks-prod-westeuropeAKS
16 nodes · 240 pods
100% Healthy
eks-staging-us-west-2EKS
8 nodes · 92 pods
2 CrashLoopBackOff
Cluster telemetry sync active
Synced 8s ago
STAGE 02

DEVHUB · KUBERNETES OBSERVABILITY

Every Cluster Resource in One Live View.

Maintain a continuously updated inventory across EKS, AKS, and on-premises clusters with node capacity, pod health, and centralized searchable logs.

Devhub
DevHub — Kube Inventory & Pod Monitor
Readiness
Kube Inventory
KubeShoot
CI/CD

EKS, AKS, and On-Premises · Continuously updated pod and node inventory

Running Pods
876
→ across 4 clusters
Restart Loops
1
▲ action required
Capacity Available
68.4%
↑ headroom OK

Active Kubernetes Pods & Health

auth-gateway-7b9c-4x8wsecurity
eks-prod-us-east-1 · Restarts: 0 · CPU/Mem: 12% / 34%
Normal operation
checkout-worker-5d8f-9q2zecommerce
eks-staging-us-west-2 · Restarts: 14 · CPU/Mem: 98% / 100%
CrashLoopBackOff (OOMKilled)
search-indexer-8k2m-1v4psearch
aks-prod-westeurope · Restarts: 3 · CPU/Mem: 84% / 78%
High memory pressure
Centralized streaming logs connected
Auto-filtering enabled
STAGE 03

DEVHUB · KUBESHOOT DIAGNOSTICS

Guided Diagnostics for Broken Pods.

Troubleshoot CrashLoopBackOff, OOMKilled, and eviction events without manually running multiple kubectl commands.

Devhub
DevHub — KubeShoot Guided Diagnostics
Readiness
Kube Inventory
KubeShoot
CI/CD

Troubleshooting checkout-worker-5d8f-9q2z · Zero manual kubectl required

KubeShoot Incident AnalysisCrashLoopBackOff

pod/checkout-worker-5d8f-9q2z (ecommerce) on eks-staging-us-west-2

1Root Cause Identified
Exit Code 137 (OOMKilled)

Pod memory limit reached (512Mi). Memory surged during catalog indexing job.

2Direct Log Access
Searchable snippet

FATAL: OutOfMemoryError: Java heap space at com.ecommerce.checkout.process(Line 142)

3Recommended Resolution
One-Click Fix Available

Increase container memory limit: 512Mi → 1024Mi. Apply right-sizing patch.

Automated root cause correlation active
No manual kubectl required
STAGE 04

DEVHUB · CI/CD & SECURITY

Every Pipeline and Scan in One View.

Track pipeline success rates, run frequency, and deployment logs alongside continuous vulnerability, SAST, and DAST security scans.

Devhub
DevHub — CI/CD Pipelines & Security Scans
Readiness
Kube Inventory
KubeShoot
CI/CD

Correlating Jenkins, GitHub Actions, Helm deployments with SAST/DAST posture

Success Rate
97.4%
↑ last 100 runs
Avg Pipeline
3.4m
↑ -45s optimized
SAST/DAST Gate
Active
→ blocking criticals

Active Pipelines & Security Gates

ecommerce-checkout(main)
Build → Test → SAST → DAST → Deploy · 3m 42s
0 Critical · 1 Med
auth-gateway(feature/oidc-v2)
Build → SAST (Failed) · 1m 12s
1 Critical SAST (Hardcoded Secret)
search-service(main)
Build → Test → DAST → Deploy · 4m 18s
0 Vulnerabilities
GitHub Actions + Jenkins + ArgoCD synced

Core Capabilities

Built for platform teams. Secured like one.

Multi-cluster Kubernetes inventory (EKS/AKS)

Node and pod health monitoring with log search

KubeShoot guided pod incident diagnostics

Centralized CI/CD pipeline performance & logs

Integrated SAST, DAST, and vulnerability scans

Role-based and team-based access control

DevHubWorkflow Architecture

DevHub workflow.

↺ CONTINUOUS RELIABILITY: CLOSED-LOOP DIAGNOSTICS01 · CATALOGMICROSERVICEREGISTERService CatalogAPI & Golden Paths02 · CONTEXTPLATFORMCONTEXTTeam OwnershipRepo & EnvironmentKUBE INVENTORYLogs · Nodes · PodsKubeShoot ActiveSECURITY GATESSAST · DAST ScannersFindings & RemediateCI / CD PIPELINEBuild · Test · DeployAutomated Delivery04 · RUNTIMEOPERATEMONITORHealth & SLI SignalsLive Deployment Drift05 · TRIAGEDIAGNOSETRIAGE ↺KubeShoot Root CauseInstant Pod Logs & Action

Operate Hub

04 · RUNTIME HEALTH

Unified operating view correlating infrastructure health, error budget consumption, and golden signals.

Runtime Service Health
SLO & Error Budget Signals
Live Deployment Drift
Golden Signal Dashboards
DevHub Product Overview
Internal Developer Platform & Golden PathsAutomated Multi-Cloud Ephemeral EnvironmentsUnified Service Catalog & Scorecards
Core MissionThe DevHub Purpose

Operate clusters and workloads with confidence.

I give your platform teams a clear view of clusters, workloads, services, and deployments so they can build and operate with confidence.
DevHub/ Internal Developer & Kubernetes Platform